Truck Schedule Modelling: Centre-Line vs. Truck Path
The Question
Being a curious kind of bloke, I was wondering if the industry standard practice of modelling trucking using the ramp centre-line, versus using the actual truck path was an issue or not?
Spoiler Alert (for the impatient): For a circular pit with a spiral ramp, the difference (in modelling) is insignificant at around 0.9% in total ramp travel time for a block at the bottom of a 50 m deep pit reducing to 0.5% for a block at the bottom of a 300 m deep pit. (And the tonnes-weighted time difference for all blocks in the pit will be very much less).
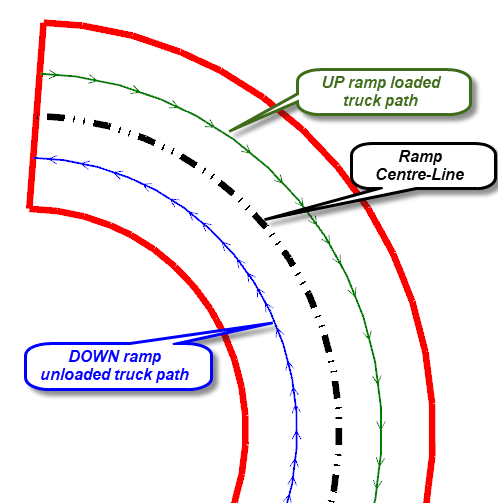
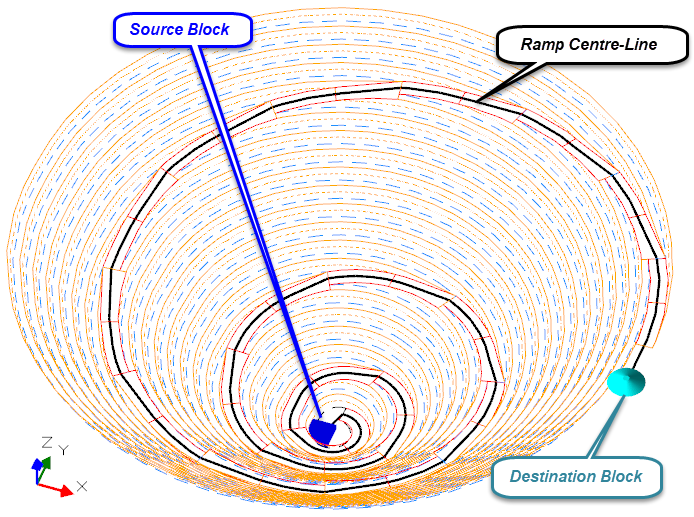
What I mean by the above question is: (referring to Figure 1) Is there a difference in modelling the truck hauling loaded up the design ramp centre-line and then down the ramp centre-line (which is the standard set-up in all trucking models) versus modelling of the actual path of a loaded truck going up-hill (to left of ramp centre-line going up) and the actual loaded path of a unloaded truck going down-hill (to left of ramp centre-line going down)?
Figure 1 – Bottom of ramp showing centre-line versus actual centre of loaded truck path and centre of unloaded truck path (inner radius = 60 m at start)
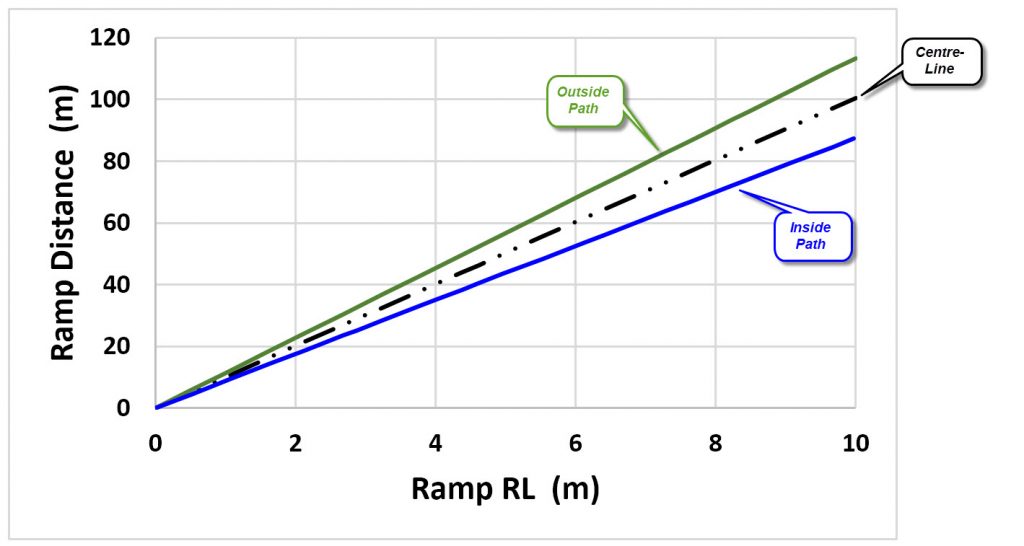
These conditions result in different gradients for the truck path (loaded and unloaded) than is occurring for the design ramp centre-line, as shown in Figure 2 for the first 10 metres in relative level (RL) change.
Figure 2 – First 10 mRL section of 10% centre-line ramp – loaded and unloaded path parameters
The Model
To answer the posed question, a trucking model (using Deswik.LHS) was set up as follows.
Pit Design:
- A simple circular pit was designed with a single spiral ramp at a 10% centre-line gradient to a depth of 400 metres.
- Ramp was selected to be 27 metres wide to accommodate a Cat 777G truck (100 short ton class).
- Pit parameters: inter ramp angle = 45°; bench height = 10 m; batter angle = 65°; berm width = 10.7 m.
The resulting pit design is shown in Figure 3.
LHS Model Set-Up
- A single block at pit bottom was selected as source (mining slot distance ≈ 58 m)
- A dummy “virtual” destination was set up near the pit crest (dump slot distance ≈ 80 m)
- Truck selected = standard Deswik truck library Cat 777G, with default settings (except default substitution maximum gradient set to 12% rather than default 10%)
- LHS model set-up using defaults, except rolling resistance changed to 2.5%.
- 3 models built and run, one for the centre-line path, one for the inside path (the path the truck takes unloaded down the ramp) and one for the outside path (the path the truck takes loaded up the ramp)
- The data for the truck path solution was reconstructed from the relevant sections of the model for the inside path and the model for the outside path patched together.
The LHS model set-up is as shown in Figure 4.
Figure 3 – The 10% ramp gradient pit as designed for the test work
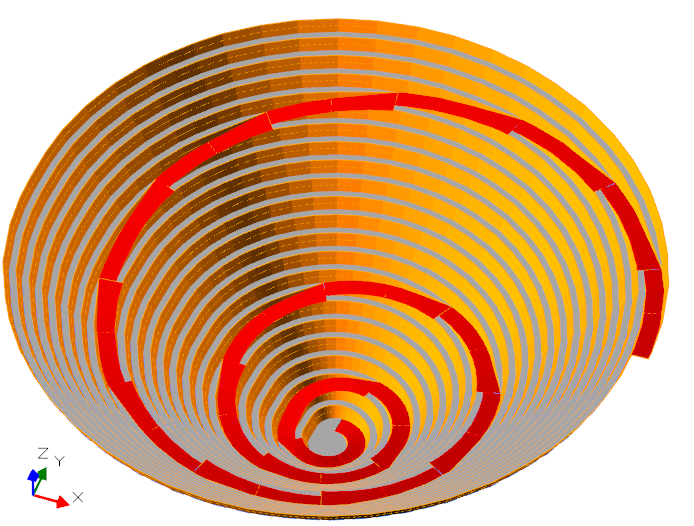
Figure 4 – The LHS truck model set-up for the Centre-Line case
Path Differences
In preparing the truck paths for LHS modelling, each segment between the individual 10 metre bench segments was “smoothed” to a constant gradient.
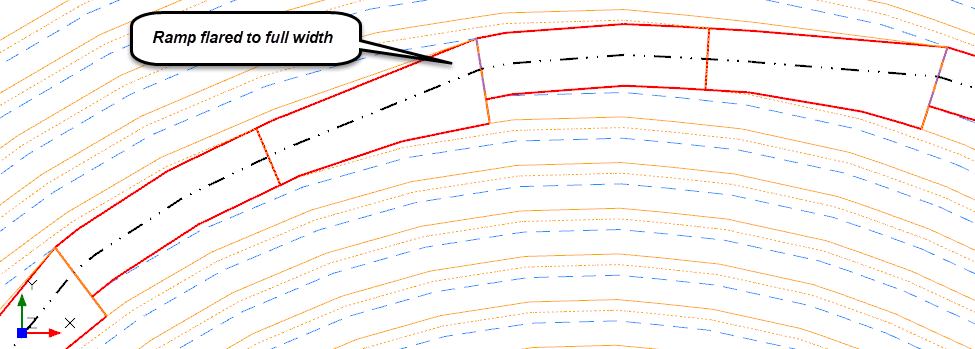
The gradients of each of the of these segments is shown in Figure 5. The segment gradients appear to change unevenly due to the manipulation of the ramp at each berm intersection. The ramp was flared out to full width as shown in Figure 6. This allows the loaded trucks to follow a smooth path up the ramp. However, this does modify the travel path gradient to be slightly lower at each of the flared segments.
Figure 5 – The difference in truck path gradients
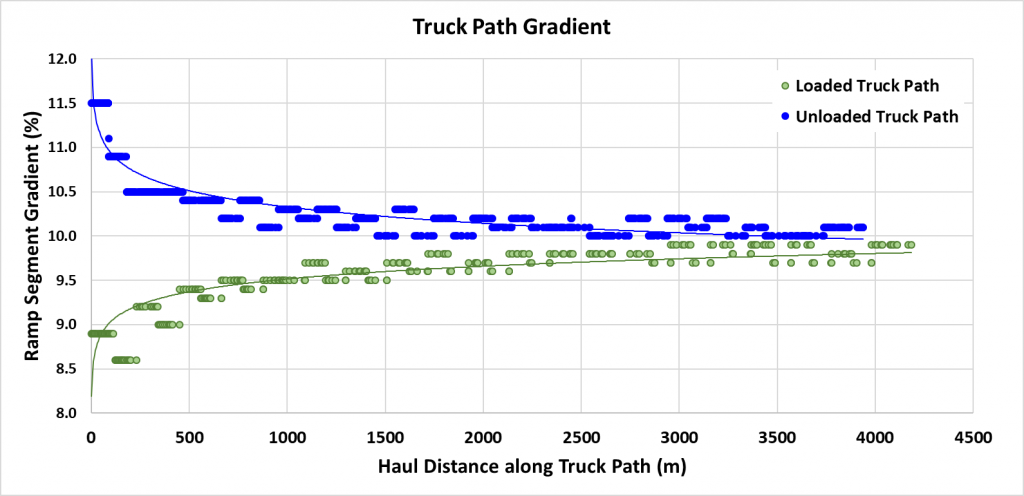
Figure 6 – Image of ramp being flared to full width at ramp-berm intersection
The Results
The results of the truck modelling are shown in Table 1 for the block at the bottom of a 400 metre deep pit.
The key result from this table is that modelling using the truck travel path gives a travel time of around 0.5% less than the centre-line modelled result. Note that when all blocks are mined out of the pit, the tonnes-weighted time difference will be much less, as the upper pit blocks are subject to a much lower gradient difference with respect to the ramp centre-line.
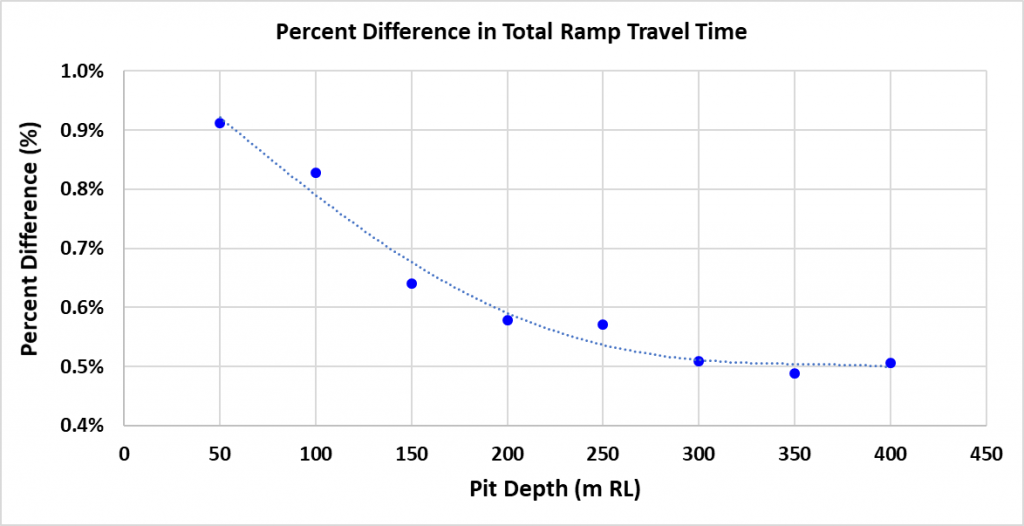
Figure 7 shows the difference in travel times for a range of pit depths (for the same pit parameters), ranging from 0.9% at 50 metres pit depth to 0.5% at 300 metres pit depth.
Table 1 – LHS truck modelling results for the two modelling alternatives at 400 m depth
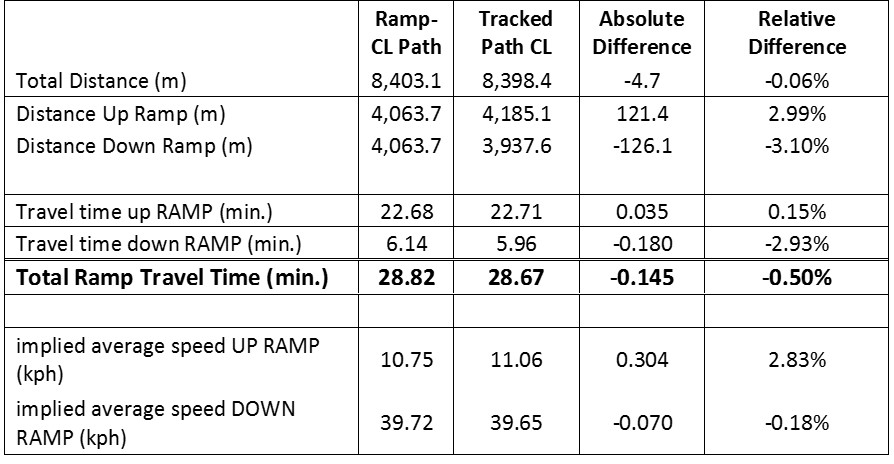
Figure 7 – The percentage difference in total ramp travel time for various pit depths
What Does It All Mean?
For the 400 m deep pit, while for the bottom bench the haul distance using the centre-line assumption versus the truck path modeling will overestimate the total cycle time by 0.5%, it also needs to be recognised that:
- The bottom 100 m of a 400 m deep pit contains only 2.6% of the total mass of the pit, with over half the total mass of the pit being in the top 100 m from the surface, where in this spiral ramp model the difference between the truck path gradients and the centre-line are almost insignificant (with less than 0.2% absolute difference in gradient).
- There are many operational uncertainties that have a far greater impact on the estimation of the truck cycle time results:
- Variations and uncertainty in truck weight (mainly the payload, but also fuel load)
- Variations and uncertainty in load time, dump time, and queue time
- Variations and uncertainty on in-situ moisture
- Variations and uncertainty on loose density (from both bank density and swell variations and uncertainty)
- Variation in the ramp gradient over very short distances (e.g. a “bump” in the ramp of as little as 10 cm can result in almost a 1% increase in grade over the wheel base length for that moment the bump is traversed)
- Variation in truck wear and maintenance (engine differences, transmission differences, etc. all resulting in variation from the theoretical rimpull curve being used)
- Variation in rolling resistance along the ramp due to time since last maintenance, variation in road sheeting, etc.
- Variation in road condition – such as rocks on the road, potholes etc., all causing drivers to vary their speed.
- Bunching of trucks behind a slow truck causing all trucks to lose time, not just the poor performing truck.
- There are even more variables with greater uncertainty that effect the total estimation of truck hours per period in a mine schedule, including:
- Inaccuracy in estimating and variations in truck availability
- Inaccuracy in estimating and variations in truck operating time.
All these causes of variation will have a far larger impact on the truck hour estimation than the assumption of centre-line travel for modelling.
Hence it can be concluded that the estimation of truck cycle time using a ramp centre-line assumption, rather than a truck travel path assumption, is not material to the estimation of truck hours for planning purposes.
As a parting note, remember: calibration of your truck hour model will be the key to accuracy and confidence in your truck hour modelling efforts.